November 20, 2025
Visual Command Center: Managing Deployments with Nosana's Dashboard
Part 2 of our deployment series: Discover how our new dashboard makes managing distributed deployments as intuitive as clicking a button.
This is Part 2 of our technical series on the Nosana Deployment Manager. In Part 1, we explored the powerful SDK and API. Today, we're diving into the visual interface that brings it all together.
From Code to Canvas
In our first post, we showed you how to manage deployments programmatically with our SDK. But not every workflow should require writing code. Whether you're debugging a deployment, monitoring resource usage, or simply want to visualize your distributed infrastructure, having a powerful dashboard is essential.
That's why we've built a comprehensive web interface for the Deployment Manager—one that doesn't sacrifice power for simplicity. Our dashboard gives you complete control over your deployments while maintaining the intuitive experience you expect from modern developer tools.
The Dashboard at a Glance
When you first visit deploy.nosana.com, you're greeted with a clean, organized view of your deployment ecosystem. The interface is designed around three core workflows:
- Creating deployments with a guided wizard
- Monitoring deployments in real-time
- API Key management
Let's explore each of these in depth.
Creating Deployments: The Wizard Experience
Step-by-Step Configuration
Our deployment creation wizard guides you through each step with contextual help and intelligent defaults.
The wizard starts by asking you the fundamental questions:
- Which Template you want to deploy? (Choose from our Official and Community Templates)
- What market do you want to deploy to? (Browse available GPU markets with pricing)
- How many replicas do you need? (Scale your deployment across multiple nodes)
- Which deployment strategy fits your use case? (SIMPLE, SIMPLE-EXTEND, SCHEDULED, or INFINITE)
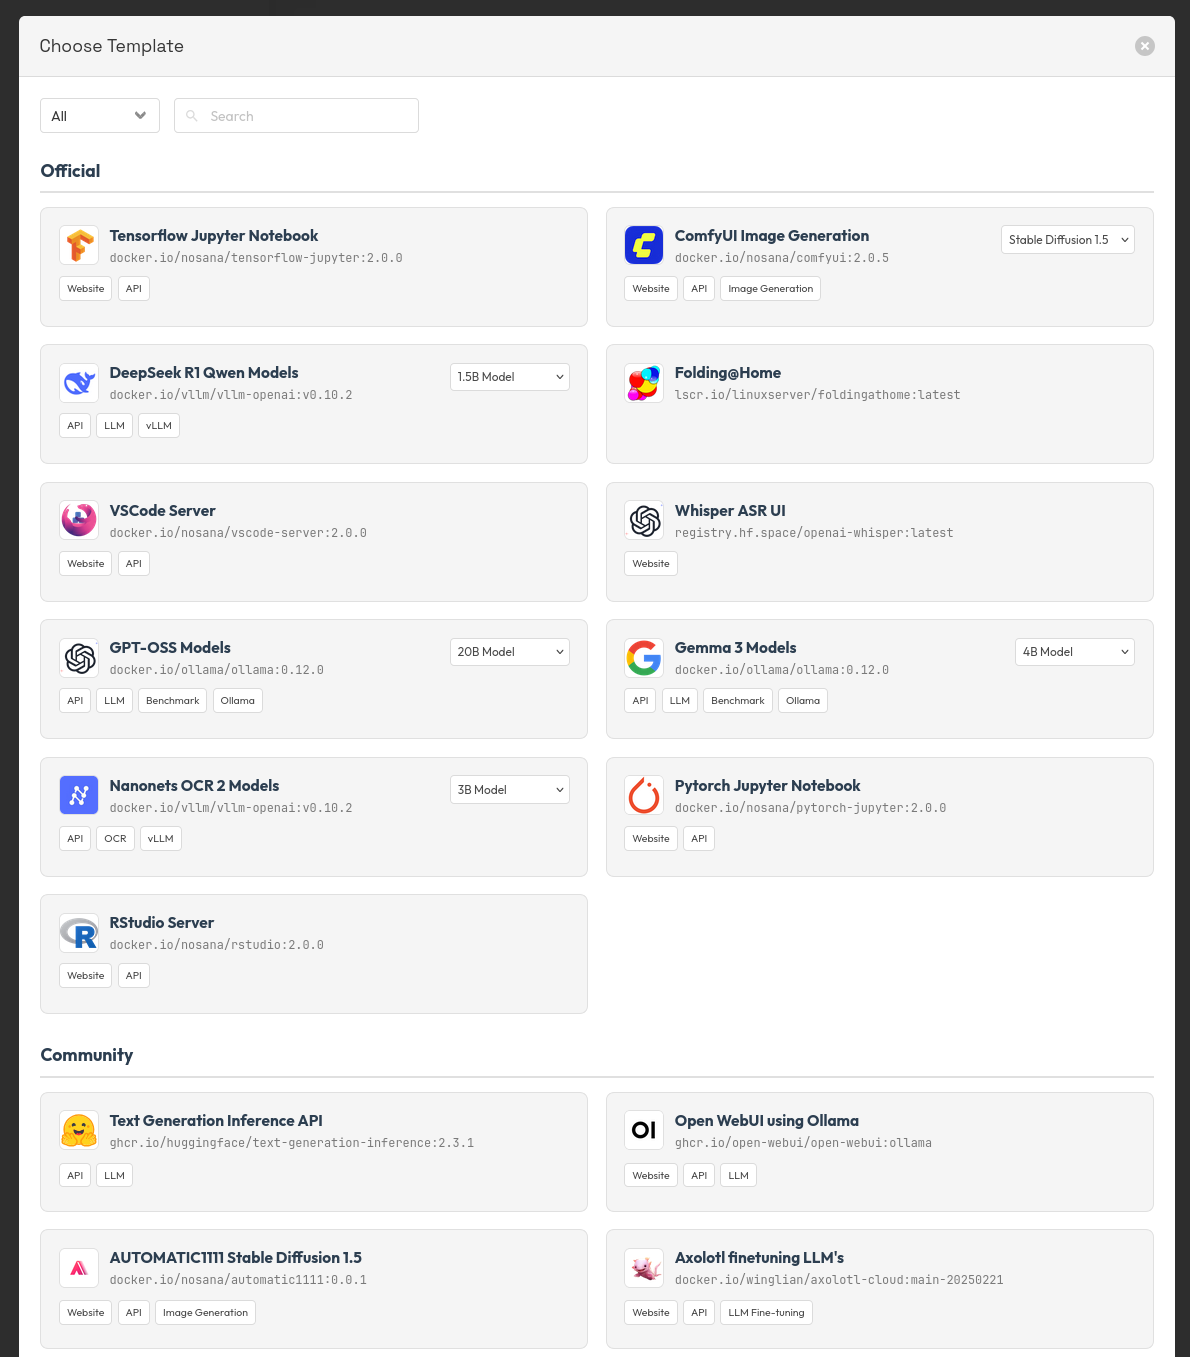
Template: Choose your Template
Do you want to run GPT-OSS, Gemma3, or Jupyter?
Choose one from our easy to deploy templates:
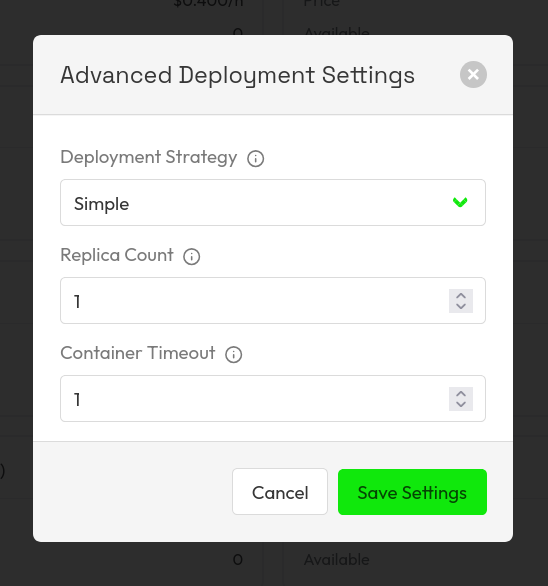
SIMPLE: Perfect for one-off batch jobs
The most simple way to get started with Nosana. This deployment strategy is handy for Jobs that you will only run once. There is no ability to change any of the job parameters after it has been posted to the Nosana.
The following job parameters can be set:
- Replica Count: Number of parallel jobs
- Container Timeout: Maximum runtime of the job, before auto-shutdown
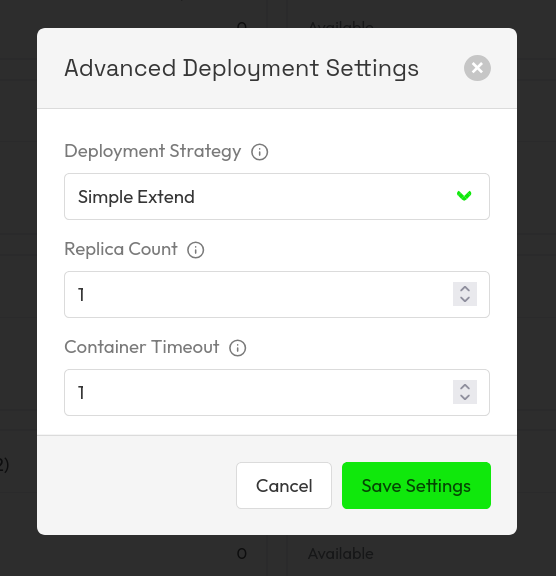
SIMPLE-EXTEND: When you need flexibility to scale after deployment
For jobs that you want the ability to extend the Replica Count and Container Timeout, the Simple Extend strategy is perfect. This is the recommended strategy for testing Nosana Jobs.
SCHEDULED: For recurring tasks and cron-like workloads
The Scheduled strategy brings the killer feature of having eternal jobs. By combining the right Container Timeout parameter and the right cron schedule, you can create an always available service. Also by setting up multiple Replicas, you can make sure that the service is fault tolerant, thus always available.
Learn more about how to use cron
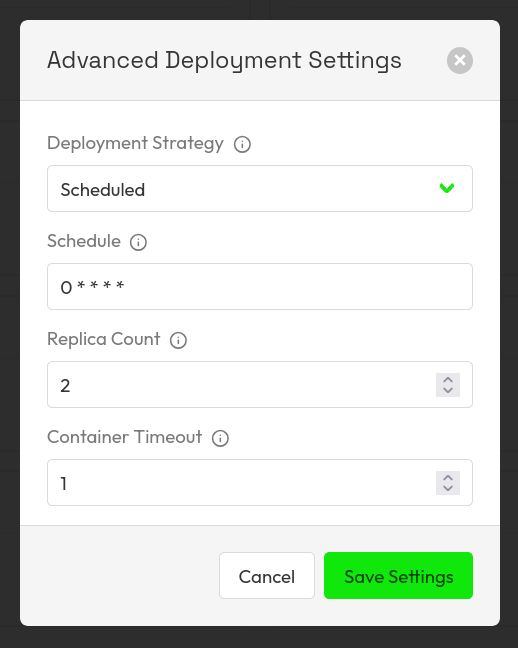
We recommend the following settings for an always available service / endpoint.
These settings will allow you to set up an endpoint, that is always available.
With the schedule set at: 0 * * * *, it will create two new jobs every hour.
With the Replica Count set at 2, if one of the jobs fail, the other can be the fallback.
And with the Container Timeout set at one hour, the job will finish after an hour, so that the new jobs can take over.
The editor provides real-time feedback on your configuration:
- Validation errors are highlighted immediately
- Estimated resource requirements are calculated automatically
- You can preview how your job will execute before deploying
Real-Time Deployment Dashboard
Live Status Monitoring
The deployment dashboard is your mission control center. Each deployment is represented as a card with key information at a glance:
- Current state (DRAFT, STARTING, RUNNING, STOPPING, STOPPED, ACHIEVED)
- Active replicas
- Time remaining (for finite deployments)
- Quick actions (Stop, Update)
- Event log tracking every action and state change
- Job Activity tracking, see the current running jobs
- Resource metrics (if available from nodes)
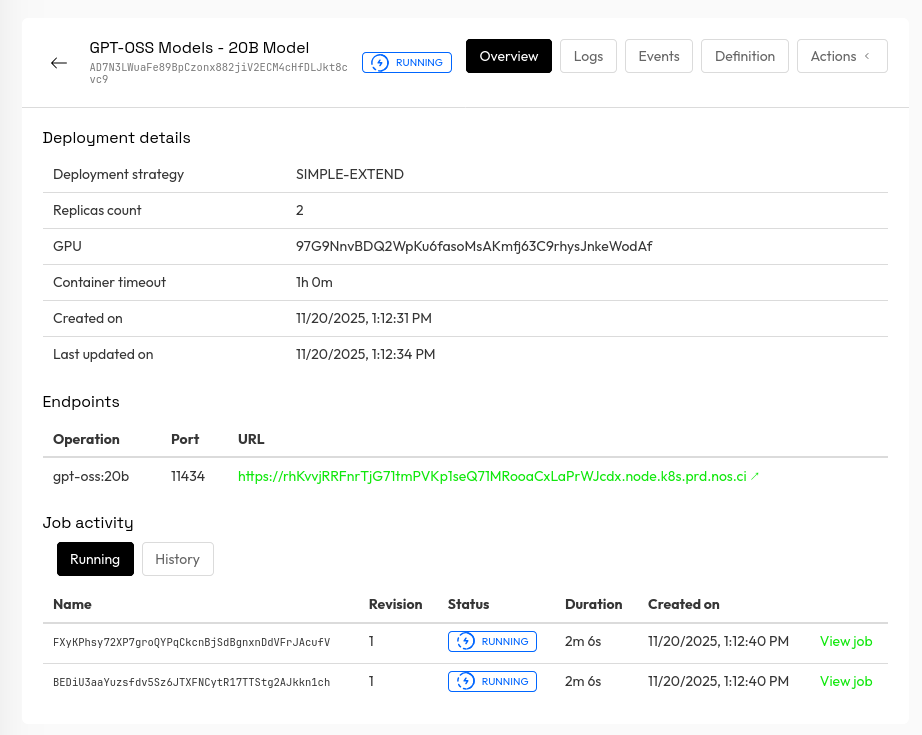
After deploying your job, you can take a look at the overview page. Here we can see the parameters set of the job, such as the deployment strategy, Replica Count. More importantly, you will find the endpoint that you can use to query your service. In the example above we can see that we are running GPT-OSS on port 11434, and it is available at https://<nosana-id>.node.k8s.prod.nos.ci.
Load balancing happens automatically over the multiple replicas that are running.
In the logs tab you can see the logs for the system, pulling down the Docker containers, and we can see the Docker logs as well of the running service.
Interactive Management
The dashboard isn't just for viewing—it's for managing. Every action you can perform via the SDK is available with a single click:
// SDK approach (still available!)
await deployment.updateReplicas(5);
await deployment.vault.topup({ SOL: 1 });
await deployment.stop();
Or simply use the UI:
- Adjust replica count
- Stop/start deployments
- Stop/start the containers
API
So now you can also manage your deployments using the Nosana API.
On the account page, you can create an API key to programmatically interact with your deployments.
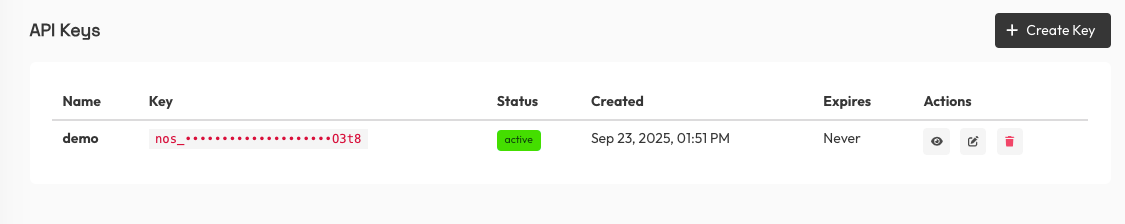
Now you can start, stop, retrieve your deployments via the API.
curl -s \
  -H "Authorization: Bearer $NOSANA_API_KEY" \
  https://dashboard.k8s.prd.nos.ci/api/deployments | jq .
Check out the API reference to learn all the methods and endpoints available, or visit Nosana Docs to learn more.
The Power of Visual + Programmatic
One of our design principles was ensuring the dashboard and SDK work seamlessly together. You're never locked into one approach:
Hybrid Workflows
Create via UI, manage via API:
curl -s \
  -H "Authorization: Bearer $NOSANA_API_KEY" \
  https://dashboard.k8s.prd.nos.ci/api/deployments | jq .
Create via SDK, monitor via UI:
// Create a deployment programmatically
const deployment = await client.deployments.create({
  name: "Batch Processing Job",
  market: "CA5pMpqkYFKtme7K31pNB1s62X2SdhEv1nN9RdxKCpuQ",
  replicas: 10,
  timeout: 3600,
  strategy: "SIMPLE",
  ipfs_definition_hash: ipfsHash,
});

console.log(`View at: https://dashboard.nosana.com/deployments/${deployment.state.id}`);
The dashboard automatically refreshes to show deployments created via the SDK or API, and all actions taken in the UI are reflected in the SDK state immediately.
Performance at Scale
We've optimized the dashboard to handle production workloads:
- WebSocket updates for real-time state changes (no polling required)
- Responsive design that works on tablets and mobile devices
Even with hundreds of active deployments, the dashboard remains snappy and responsive.
Try It Today
The Deployment Manager dashboard is live and ready for you to explore.
Get started now:
- Visit dashboard.nosana.com
- Sign in with your Google Account
- Navigate to the Deployments section
- Click "Create Deployment" to launch the wizard
No installation required, no configuration needed. If you already have deployments running via the SDK, they'll appear automatically.
Bringing It All Together
The Nosana Deployment Manager is unique because it doesn't force you to choose between power and usability. Whether you're:
- A DevOps engineer automating deployments with scripts
- A developer debugging a single failing replica
- A product manager monitoring infrastructure costs
- A data scientist running one-off experiments
...the dashboard has you covered. Combined with the SDK we explored in Part 1, you have complete flexibility to work the way you want.
What's Next?
In Part 3 of this series, we'll dive deep into advanced use cases and production patterns. We'll explore:
- Building self-healing, always-on services with INFINITE deployments
- Cost optimization strategies and monitoring best practices
- Production deployment patterns for high-availability applications
- Multi-market deployment strategies for geographic distribution
Want to access to exclusive builder perks, early challenges, and Nosana credits? Subscribe to our newsletter and never miss an update.
👉 Join the Nosana Builders Newsletter
Be the first to know about:
- 🧠 Upcoming Builders Challenges
- 💸 New reward opportunities
- ⚙ Product updates and feature drops
- 🎁 Early-bird credits and partner perks
Join the Nosana builder community today — and build the future of decentralized AI.

